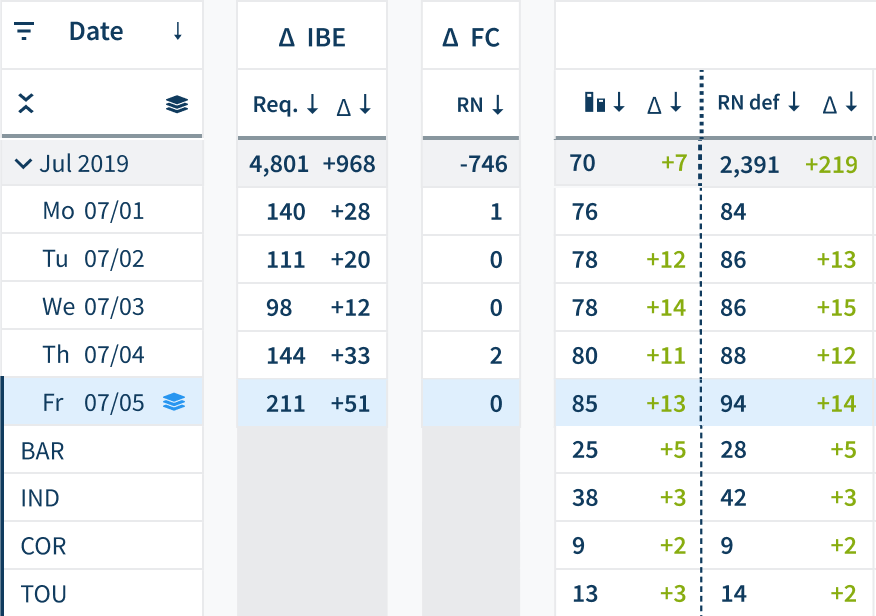
Smart View
Call it Smart View, or call it the ultimate rate shopping guru. Anyway, this is serving as the beating heart of our operations. Effortlessly keep an eye on not only your own rates but also those of your competitors. And wait, that's not all!
A Question of Perspectives.
Rate shopping is one thing. Turning rate shopping into real hotel market intelligence, is playing a different league! HQ revenue's Smart View gives you every perspective you'll need ... and this is not even all ...
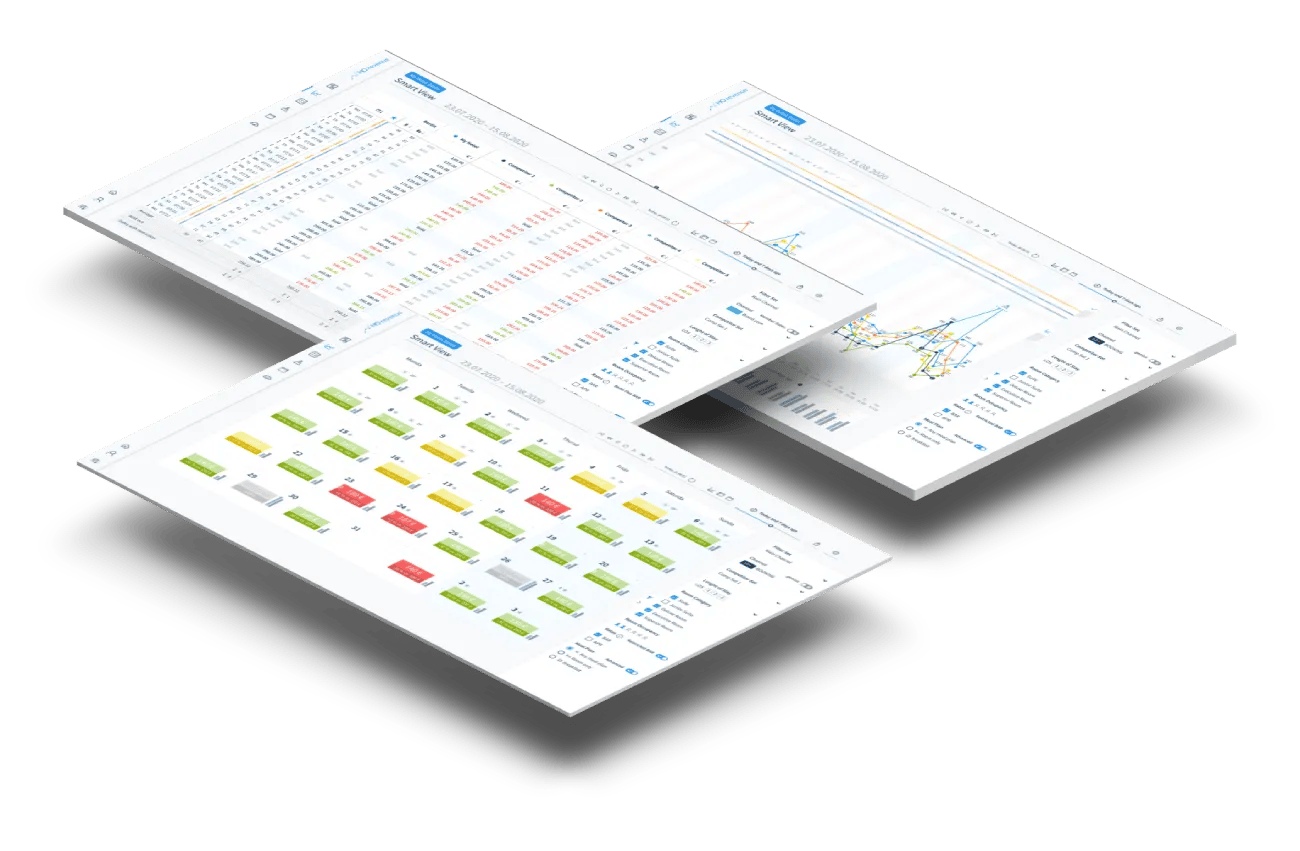
HQ revenue's Smart View offers revenue managers the freedom to view their KPIs in a way that suits their fancy. Easily switch between a calendar view, an Excel-style table, and a chart view with just a click.
More Than Just Rate Shopping
Create and manage multiple Smart Views to have all the perspectives you need right at your fingertips.
Smart View...s!
Different perspectives on all relevant data and KPIs are just one click away.
More than Rate Shopping
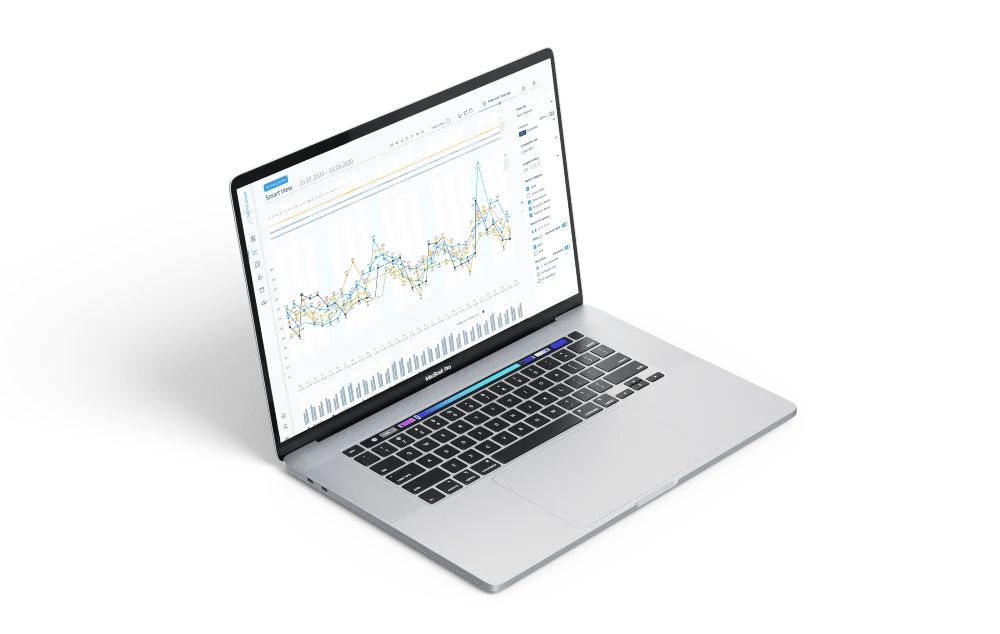
The Smart View graph displays your and your competitors' rates in a clear and intuitive way.
Customize This!
Tailor the graph to your needs by leveraging HQ revenue's smart filters, Date Picker, and the Time Slider!
Export
Not everyone in your organization is a digital native? We got your back – just export everything to XLS.
Flexibility
Semi-Flexible / restricted BAR Rates filter can be associated with either BAR or APR rates.
Single Click
A condensed Smart View can be accessed from literally anywhere in the app.
Comparison Period: Choose the perfect comparison period with our innovative time slider feature. Analyze data from specific weeks, months, or years effortlessly. Stay ahead by exploring trends, patterns, and insights for a competitive edge.
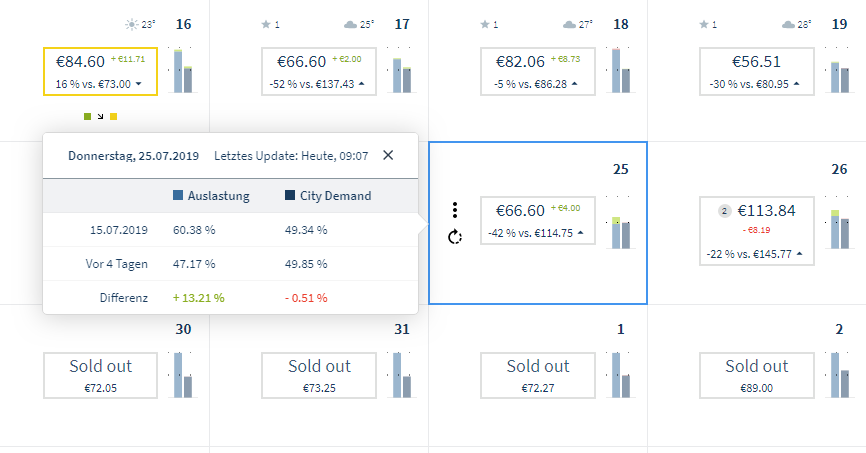
City Demand & Occupancy: Understand your occupancy rates by comparing them to current day demand. Analyze and benchmark against the past 30 days for valuable information. Maximize your potential by aligning occupancy with changing demand.
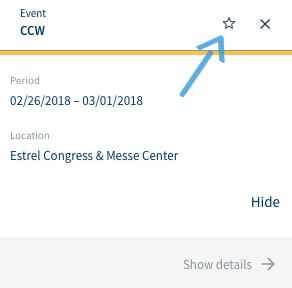
Feeds: Plan your strategy easily with dynamic feeds. Activate feeds that matter to you, such as events, holidays, vacations, and weather forecasts. Access all relevant information at a glance with our intuitive Smart View. Stay updated and stay ahead with our comprehensive feed system.
Time Slides ... Your Comparison Period
With the innovative time slider feature, you'll always have the power to choose the perfect comparison period that suits your needs. Whether you want to analyze data from a specific week, month, or even year, our user-friendly interface allows you to effortlessly navigate through time and add snapshot data with just one click. Stay ahead of the game by exploring trends, patterns, and insights that will give you a competitive edge in the market.
City Demand & Occupancy
Gain a comprehensive understanding of your own occupancy rates by comparing them to the demand in your destination for the current day. But why stop there? Our cutting-edge technology also enables you to analyze and benchmark your data against the past 30 days, providing you with valuable information to make informed decisions. Stay in tune with the pulse of your city and ensure that you are maximizing your potential by aligning your occupancy with the ever-changing demand.
Feed on Data!
Planning your strategy just got easier with our dynamic feeds feature. Activate the feeds that matter most to you, such as events, holidays, vacations, and even weather forecasts, and watch as they seamlessly integrate into our intuitive Smart View. No more wasting time searching for information across multiple platforms – with one quick glance, you can access all the relevant information that will impact your business. Stay updated and stay ahead with our comprehensive feed system.
More Hotel Market Intelligence
on the HQ revenue blog:

Easy Cluster Revenue Management with the Multi-Property Dashboard

Video: Fitting the HQ revenue Tools to YOUR Workflow
.jpg?width=400&height=330&name=hq-revenue_blog_zeitfresser-im-revenuemanagement-tools_kl%20(1).jpg)
Revenue management – time wasters, automation, and which tools are *really* important
Still not convinced ... ?
Sign up for a demo right away, and see for yourself!

